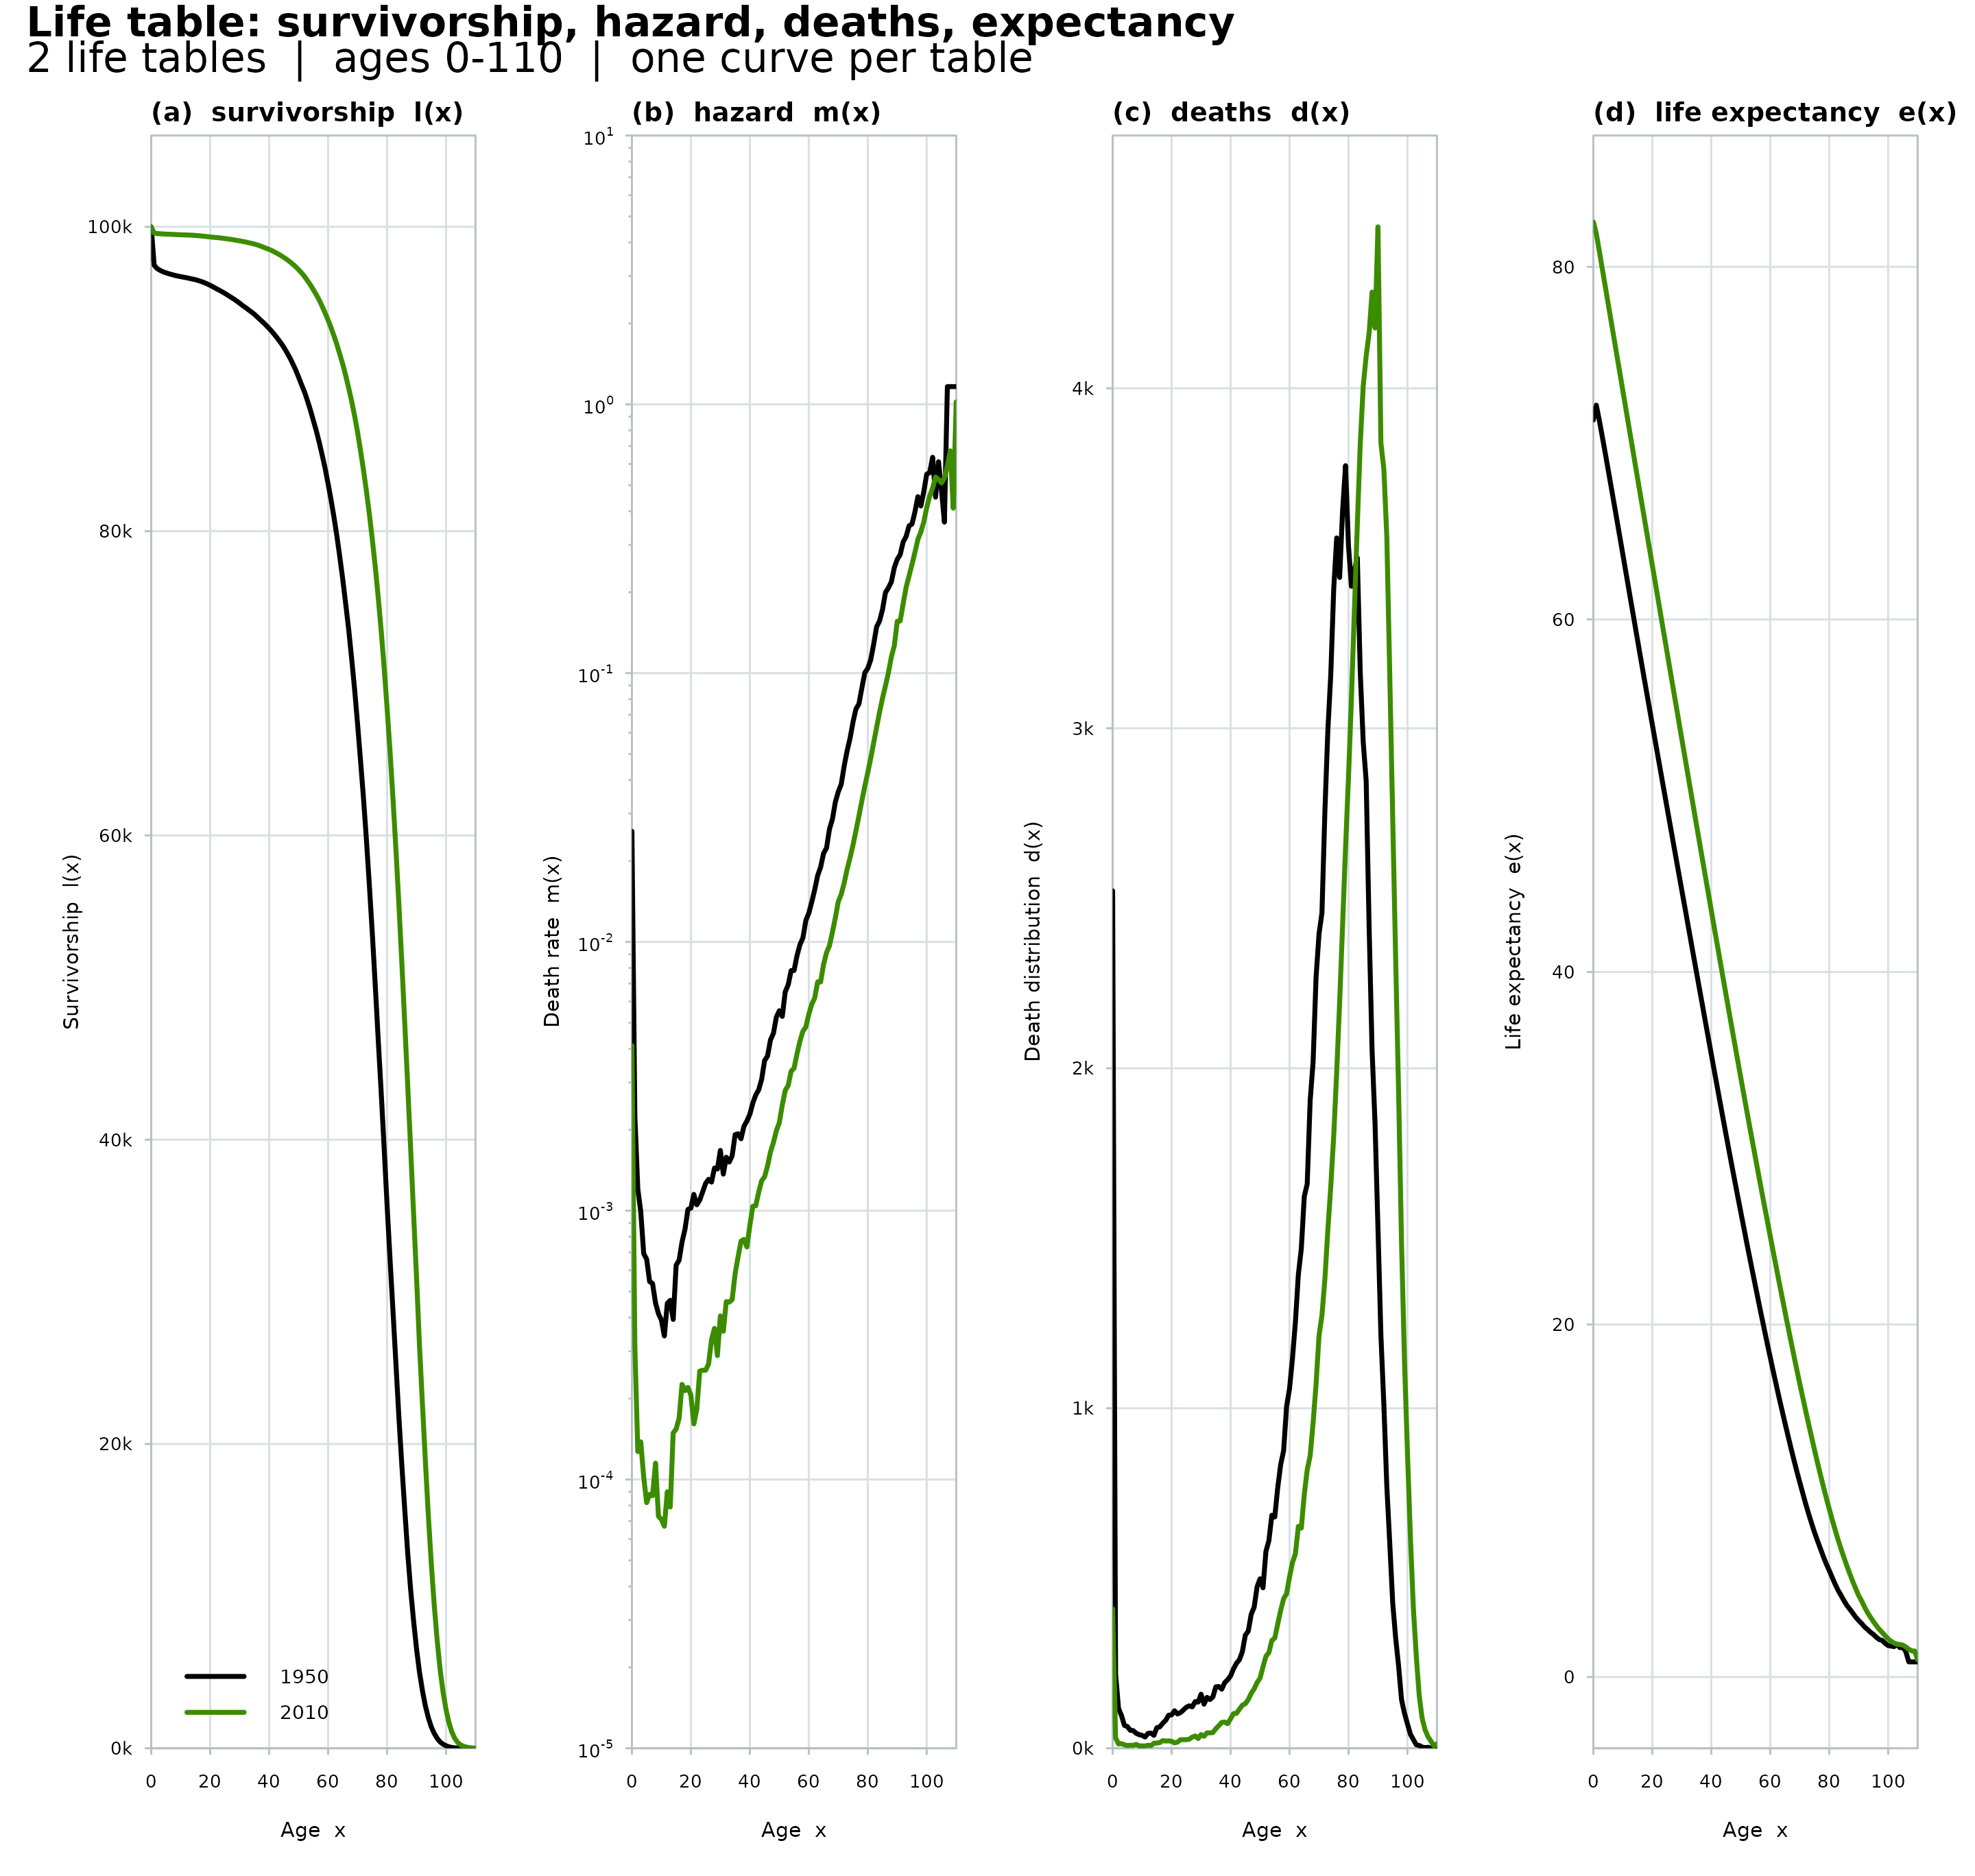
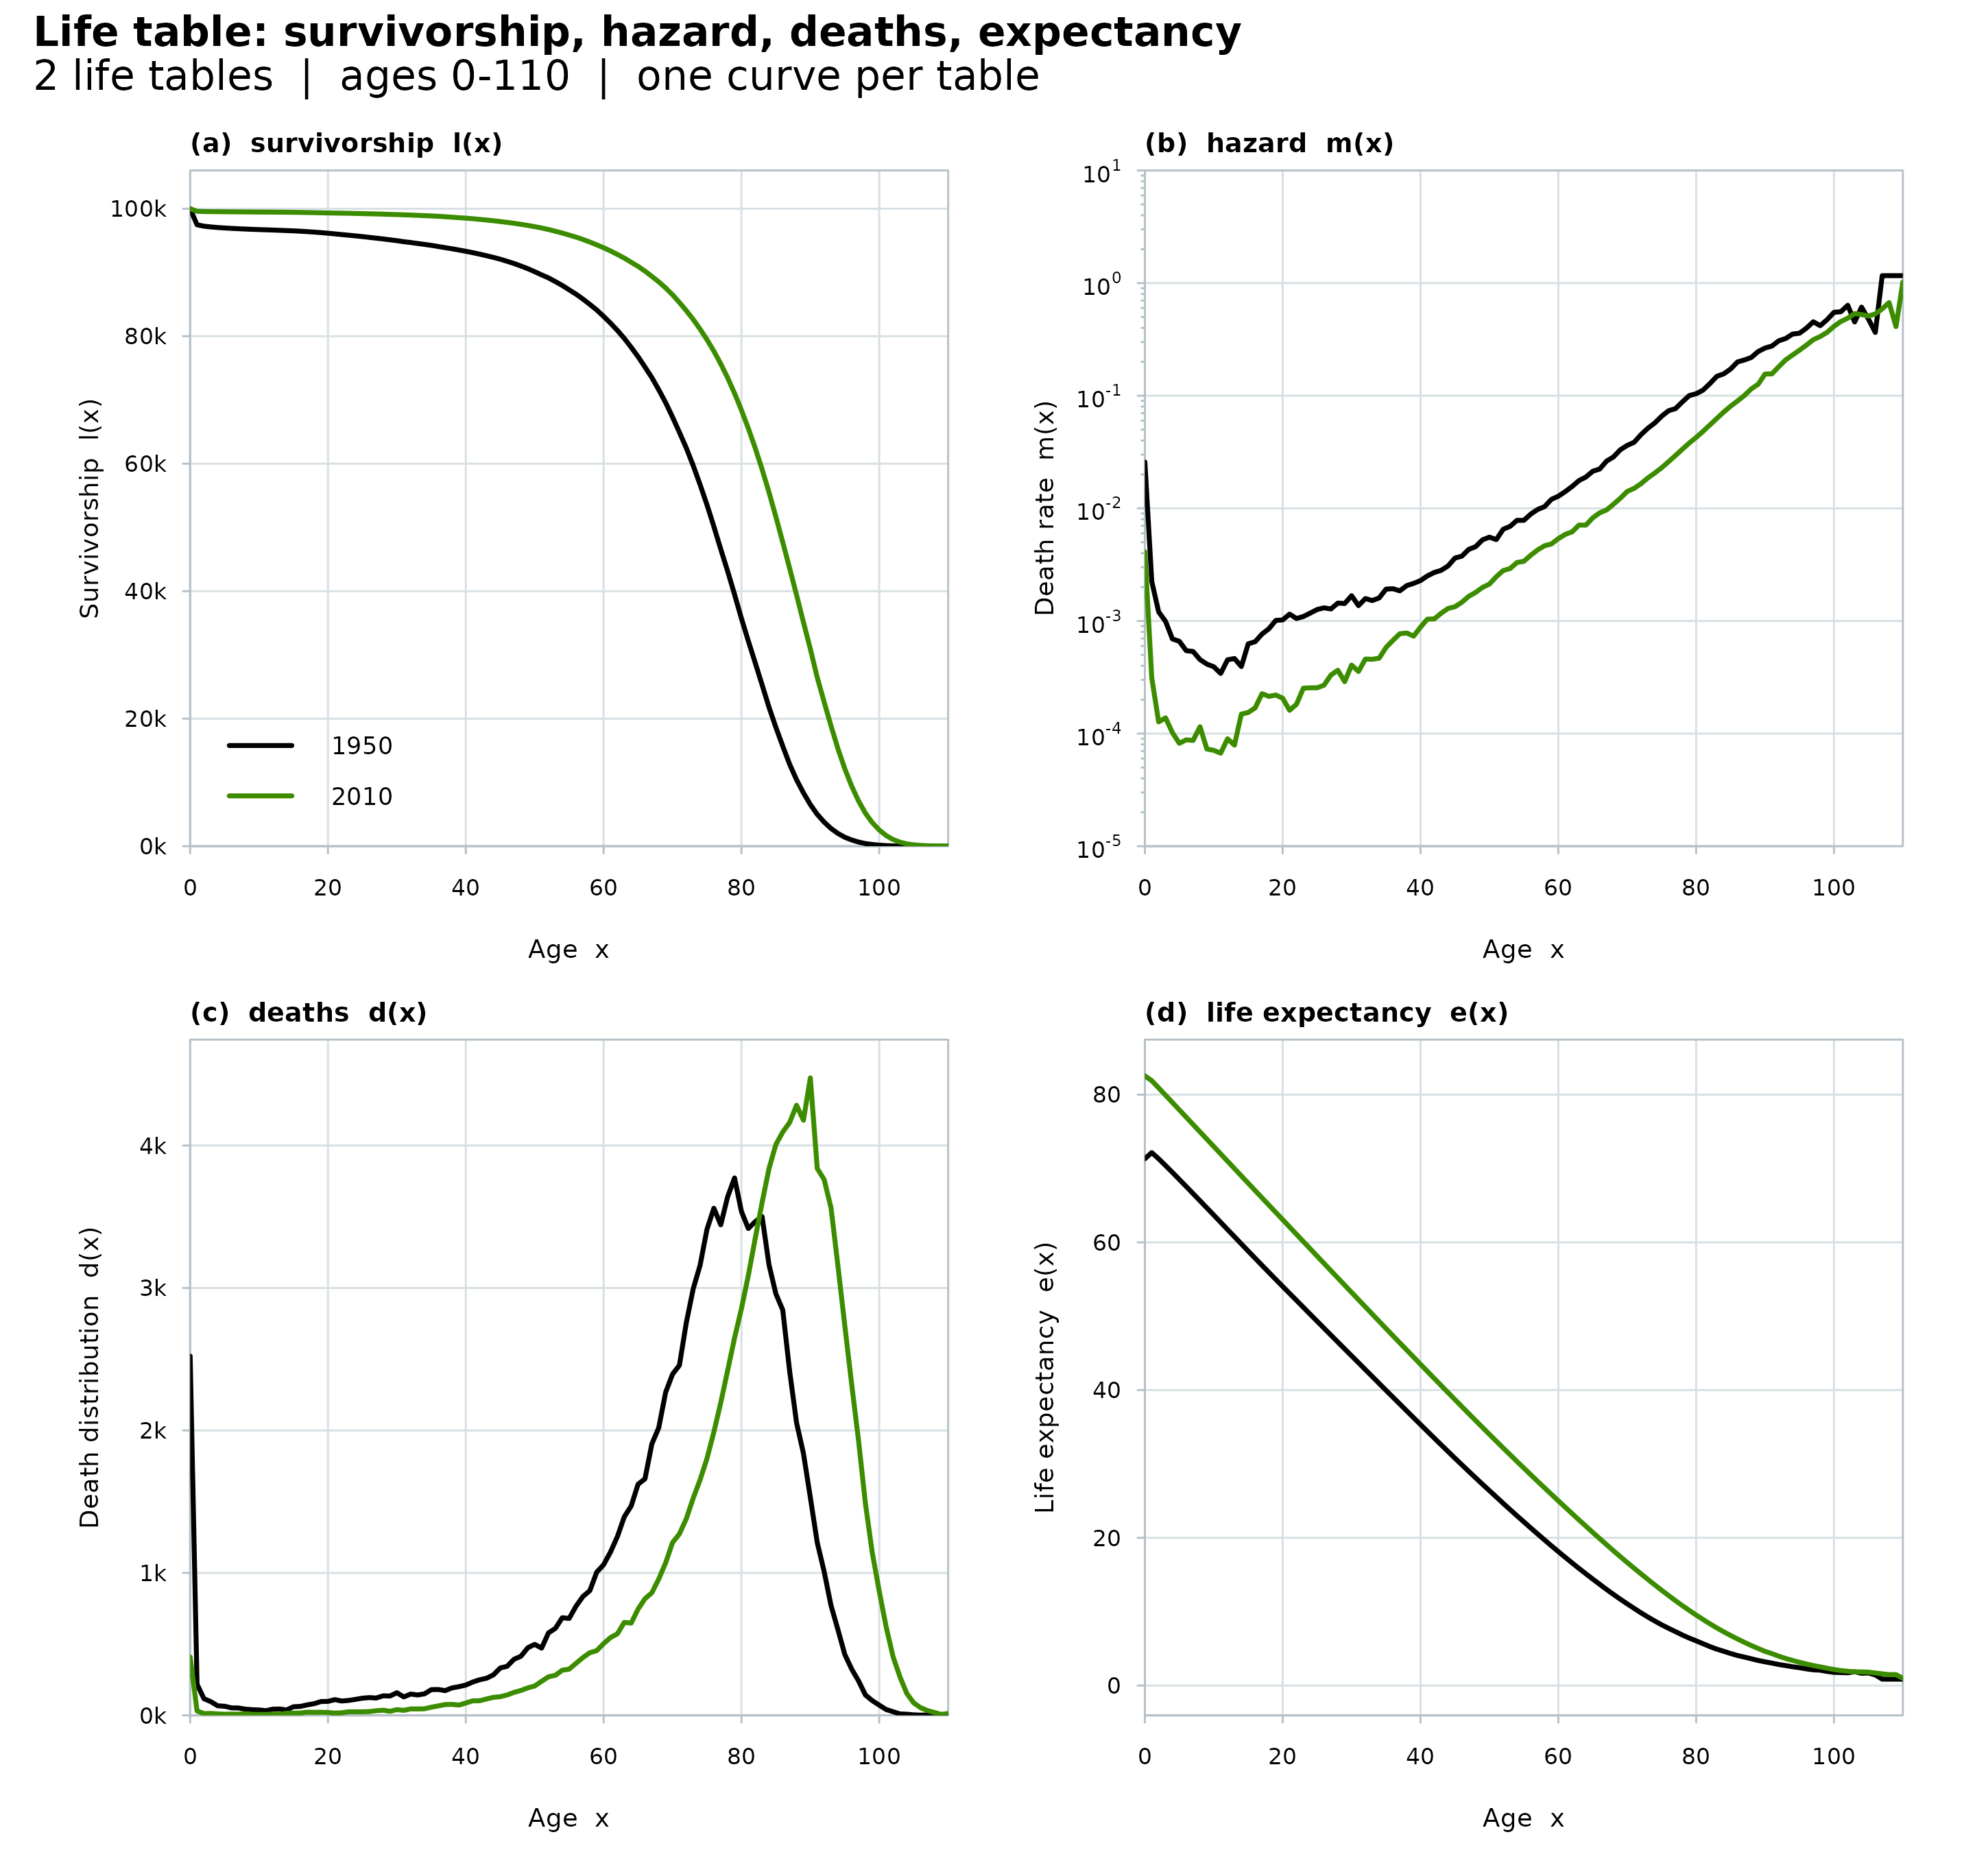
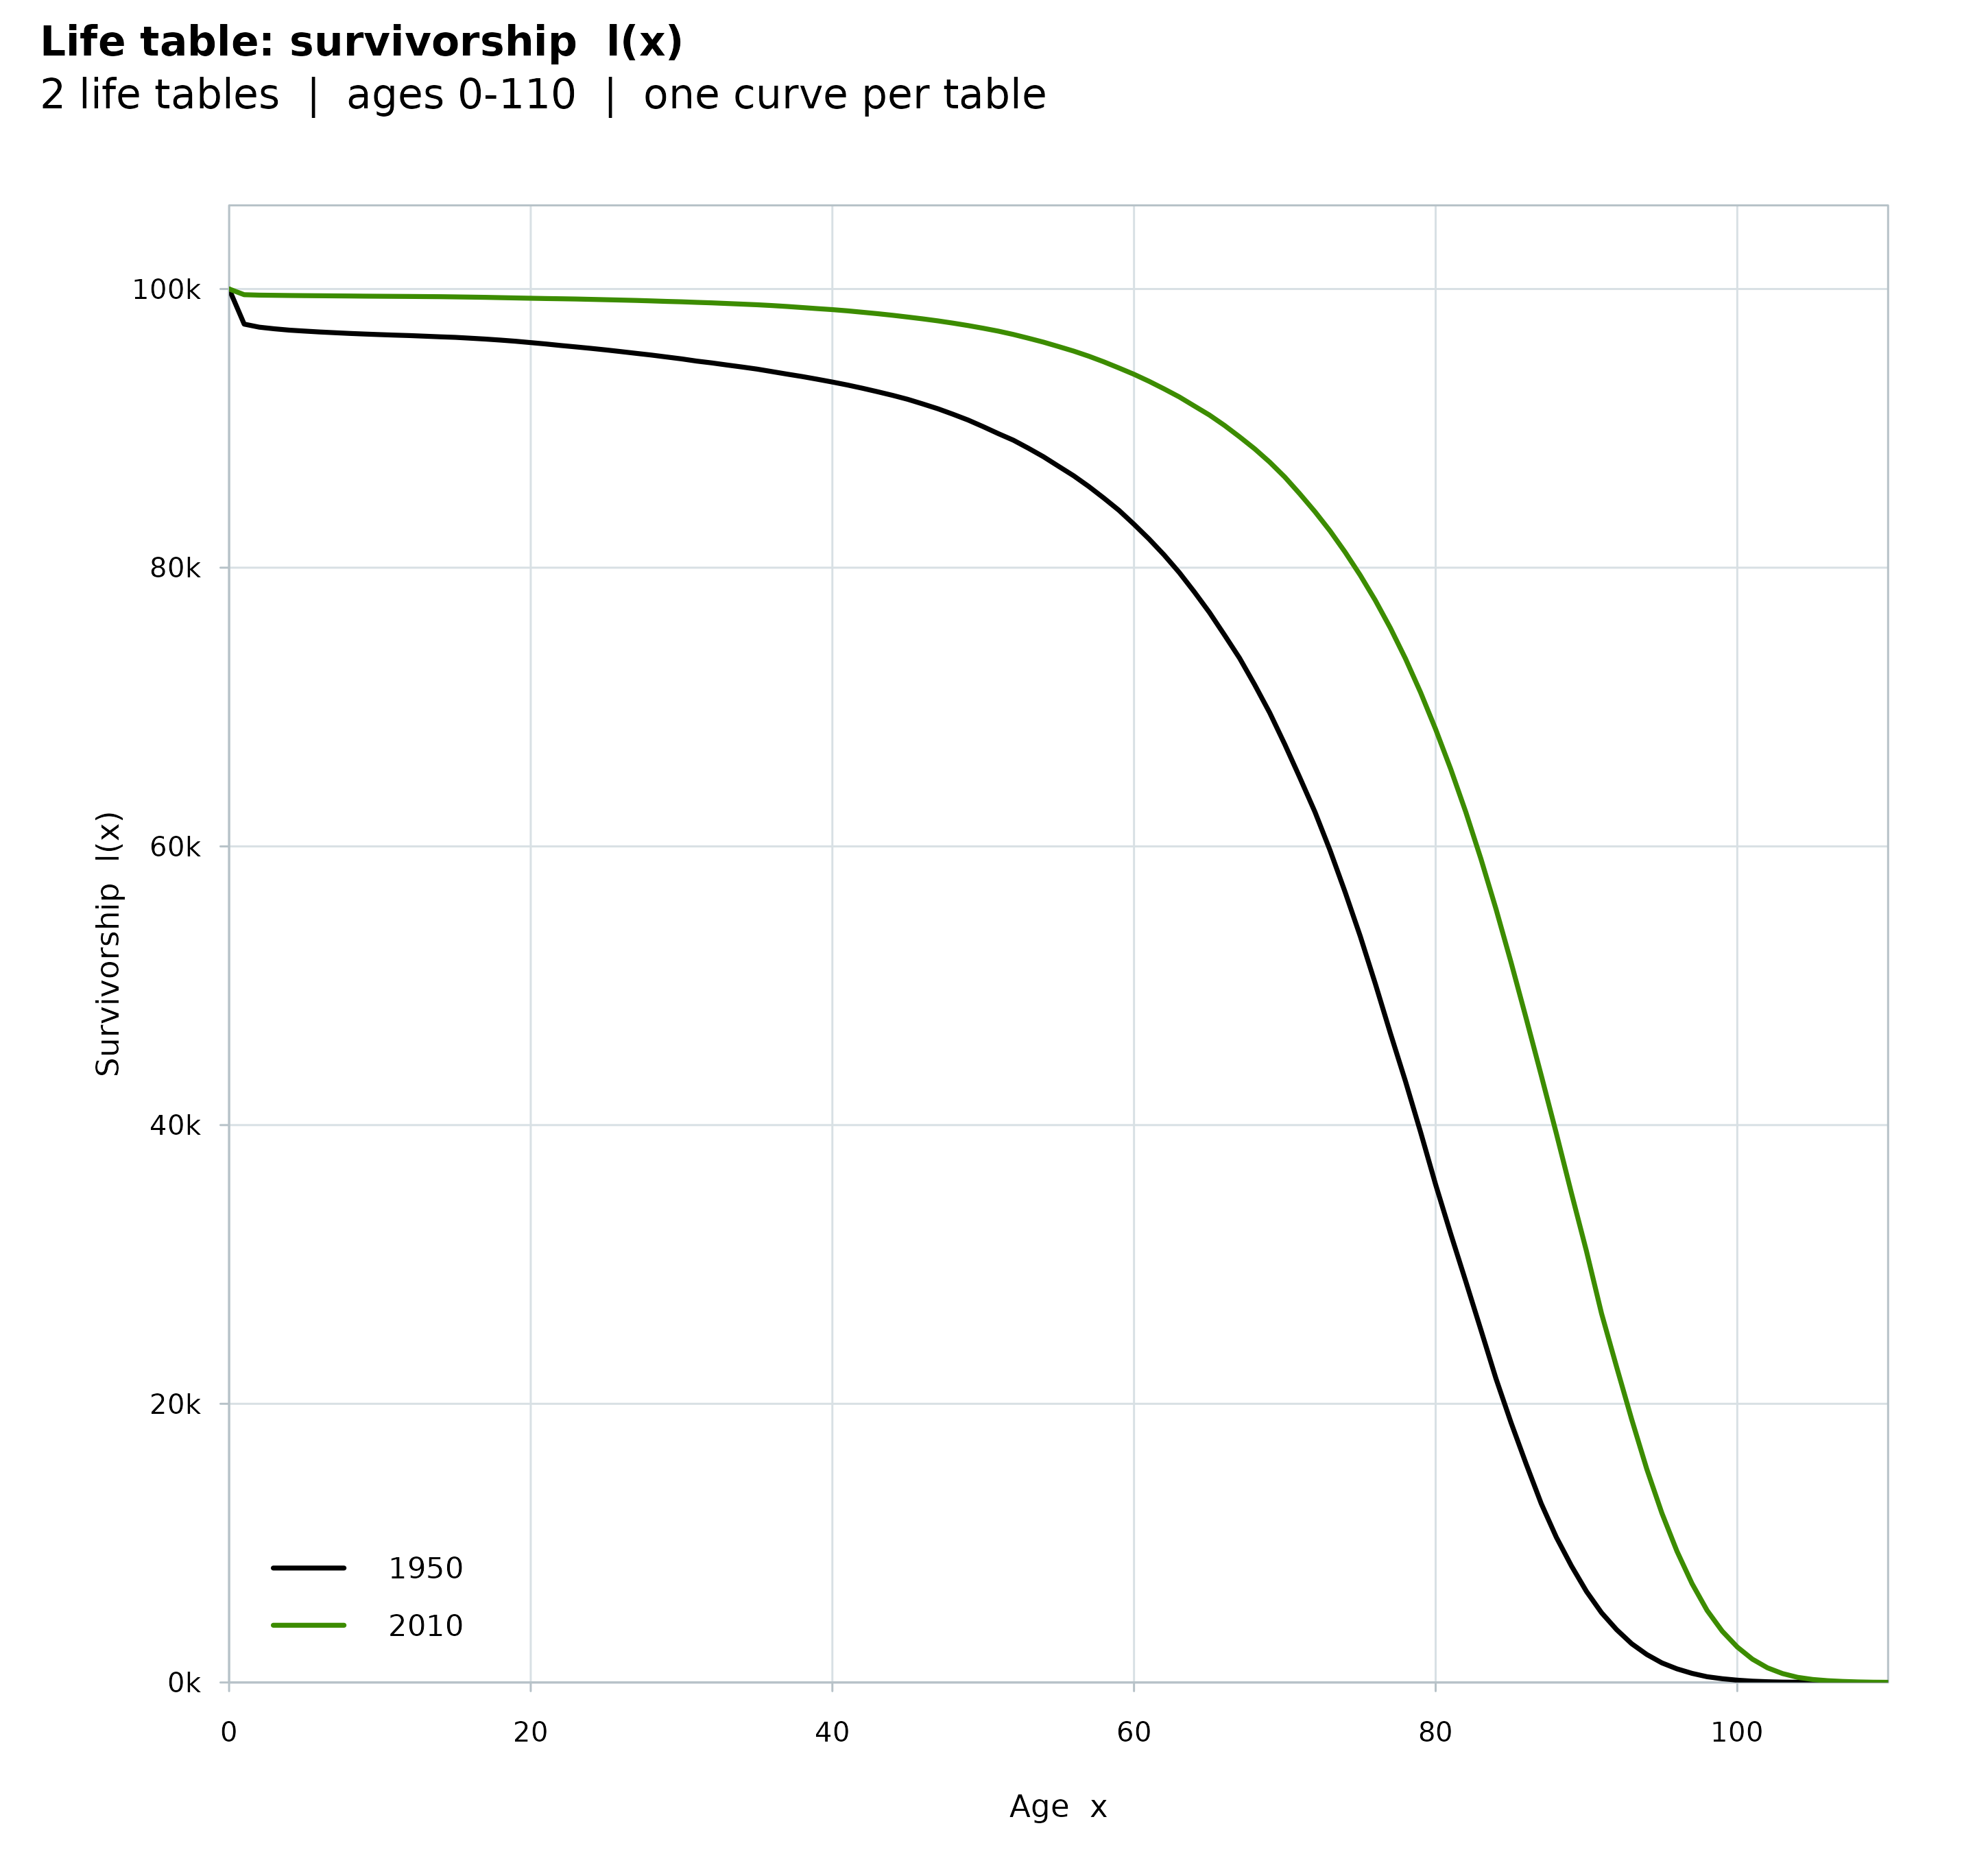
Draws the classic life table figures in the house style: the survivorship
\(l_x\), the hazard \(m_x\) on a log scale, the death distribution
\(d_x\) and the life expectancy \(e_x\). When the table holds several
life tables, from a matrix input or from a LawTable built on
several parameter sets, each table is drawn as one curve and the legend
labels the tables.
Arguments
- x
An object of class
"LifeTable".- which
Which panels to draw:
"all"(the default; the four panels), or a single panel:"lx","hazard","dx"or"ex".- split
How to arrange the panels when more than one is drawn:
NULL(the default) draws the four panels in a c(2, 2) grid; give a length-2 integer c(nrow, ncol) to split them yourself, such asc(1, 4)for one row orc(4, 1)for one column.- ...
Further arguments; currently ignored.
Examples
x <- as.numeric(rownames(ahmd$mx))
LT <- LifeTable(x = x, mx = ahmd$mx[, c("1950", "2010")])
#> 'mx' contains missing or non-finite values at age(s) 110. Rows below age 100 are returned as NA with the survivorship bridged across the gap; rows from age 100 are replaced with the highest rate observed there.
plot(LT)
 plot(LT, which = "lx")
 plot(LT, split = c(1, 4))