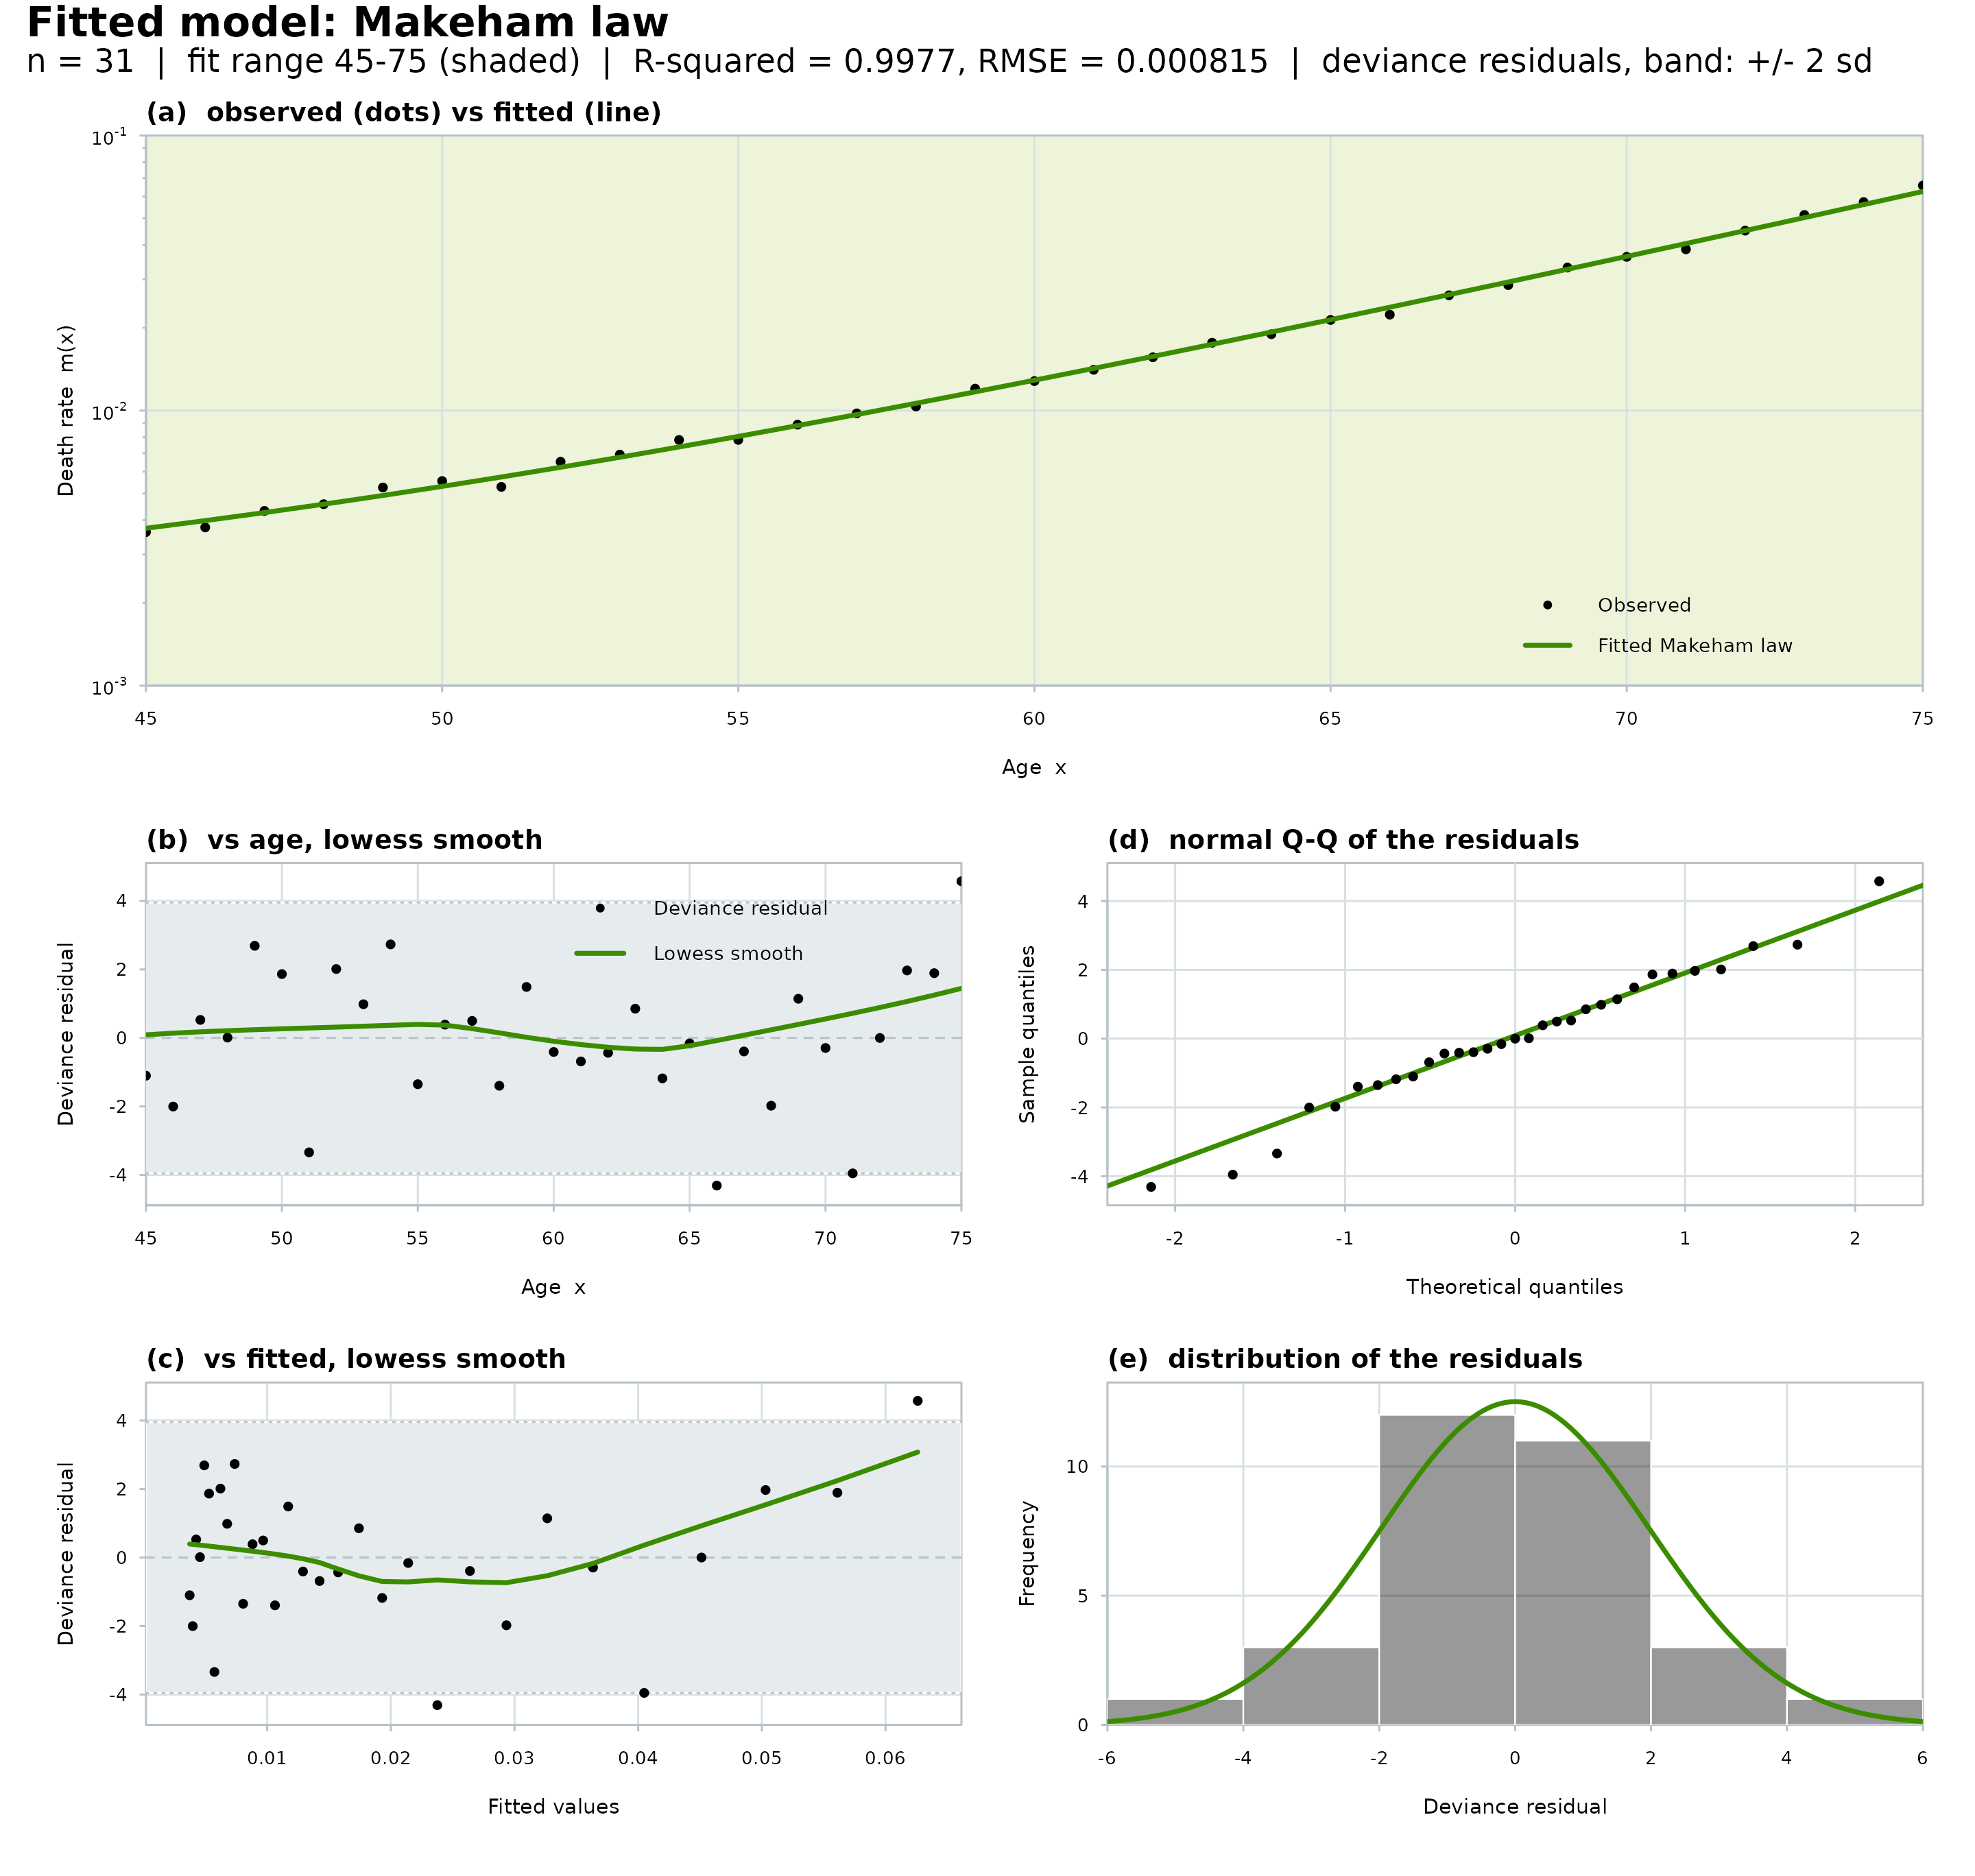
Draws the figures of a "MortalityLaw" fit in the house style. The fit
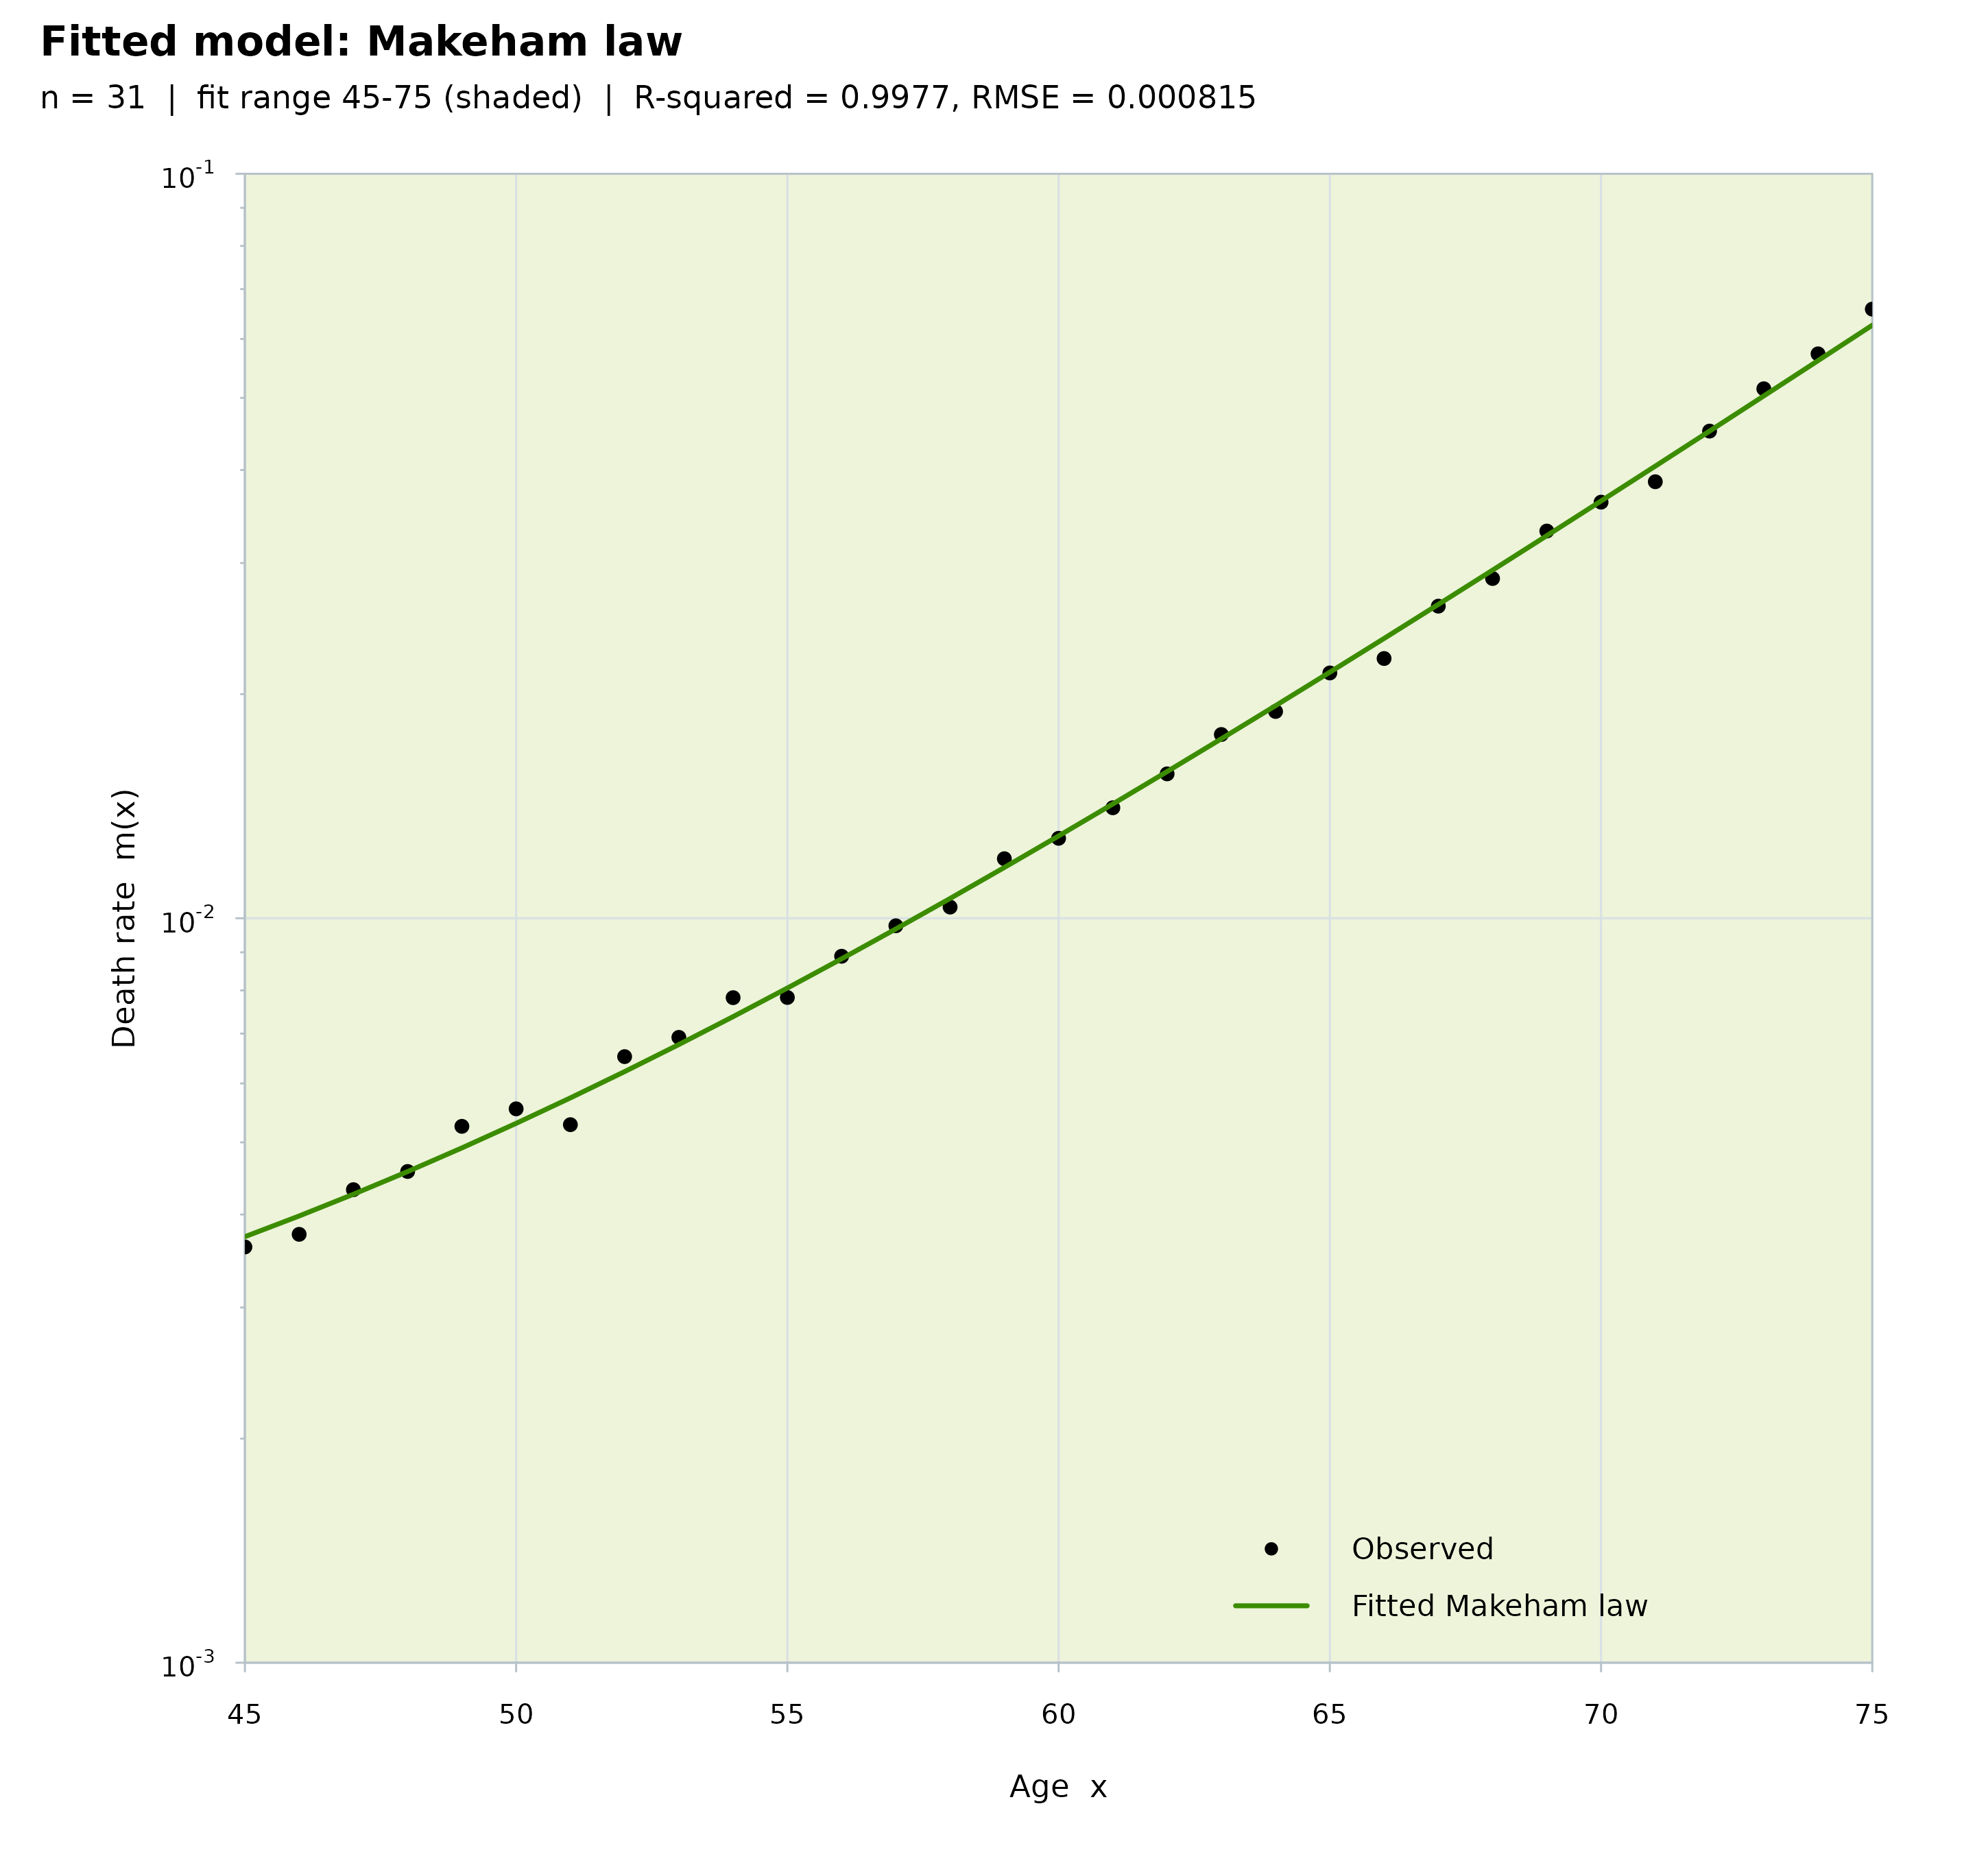
chart puts the observed and the fitted mortality on a log scale, with the
fitted age range shaded and a goodness-of-fit subtitle. The residual
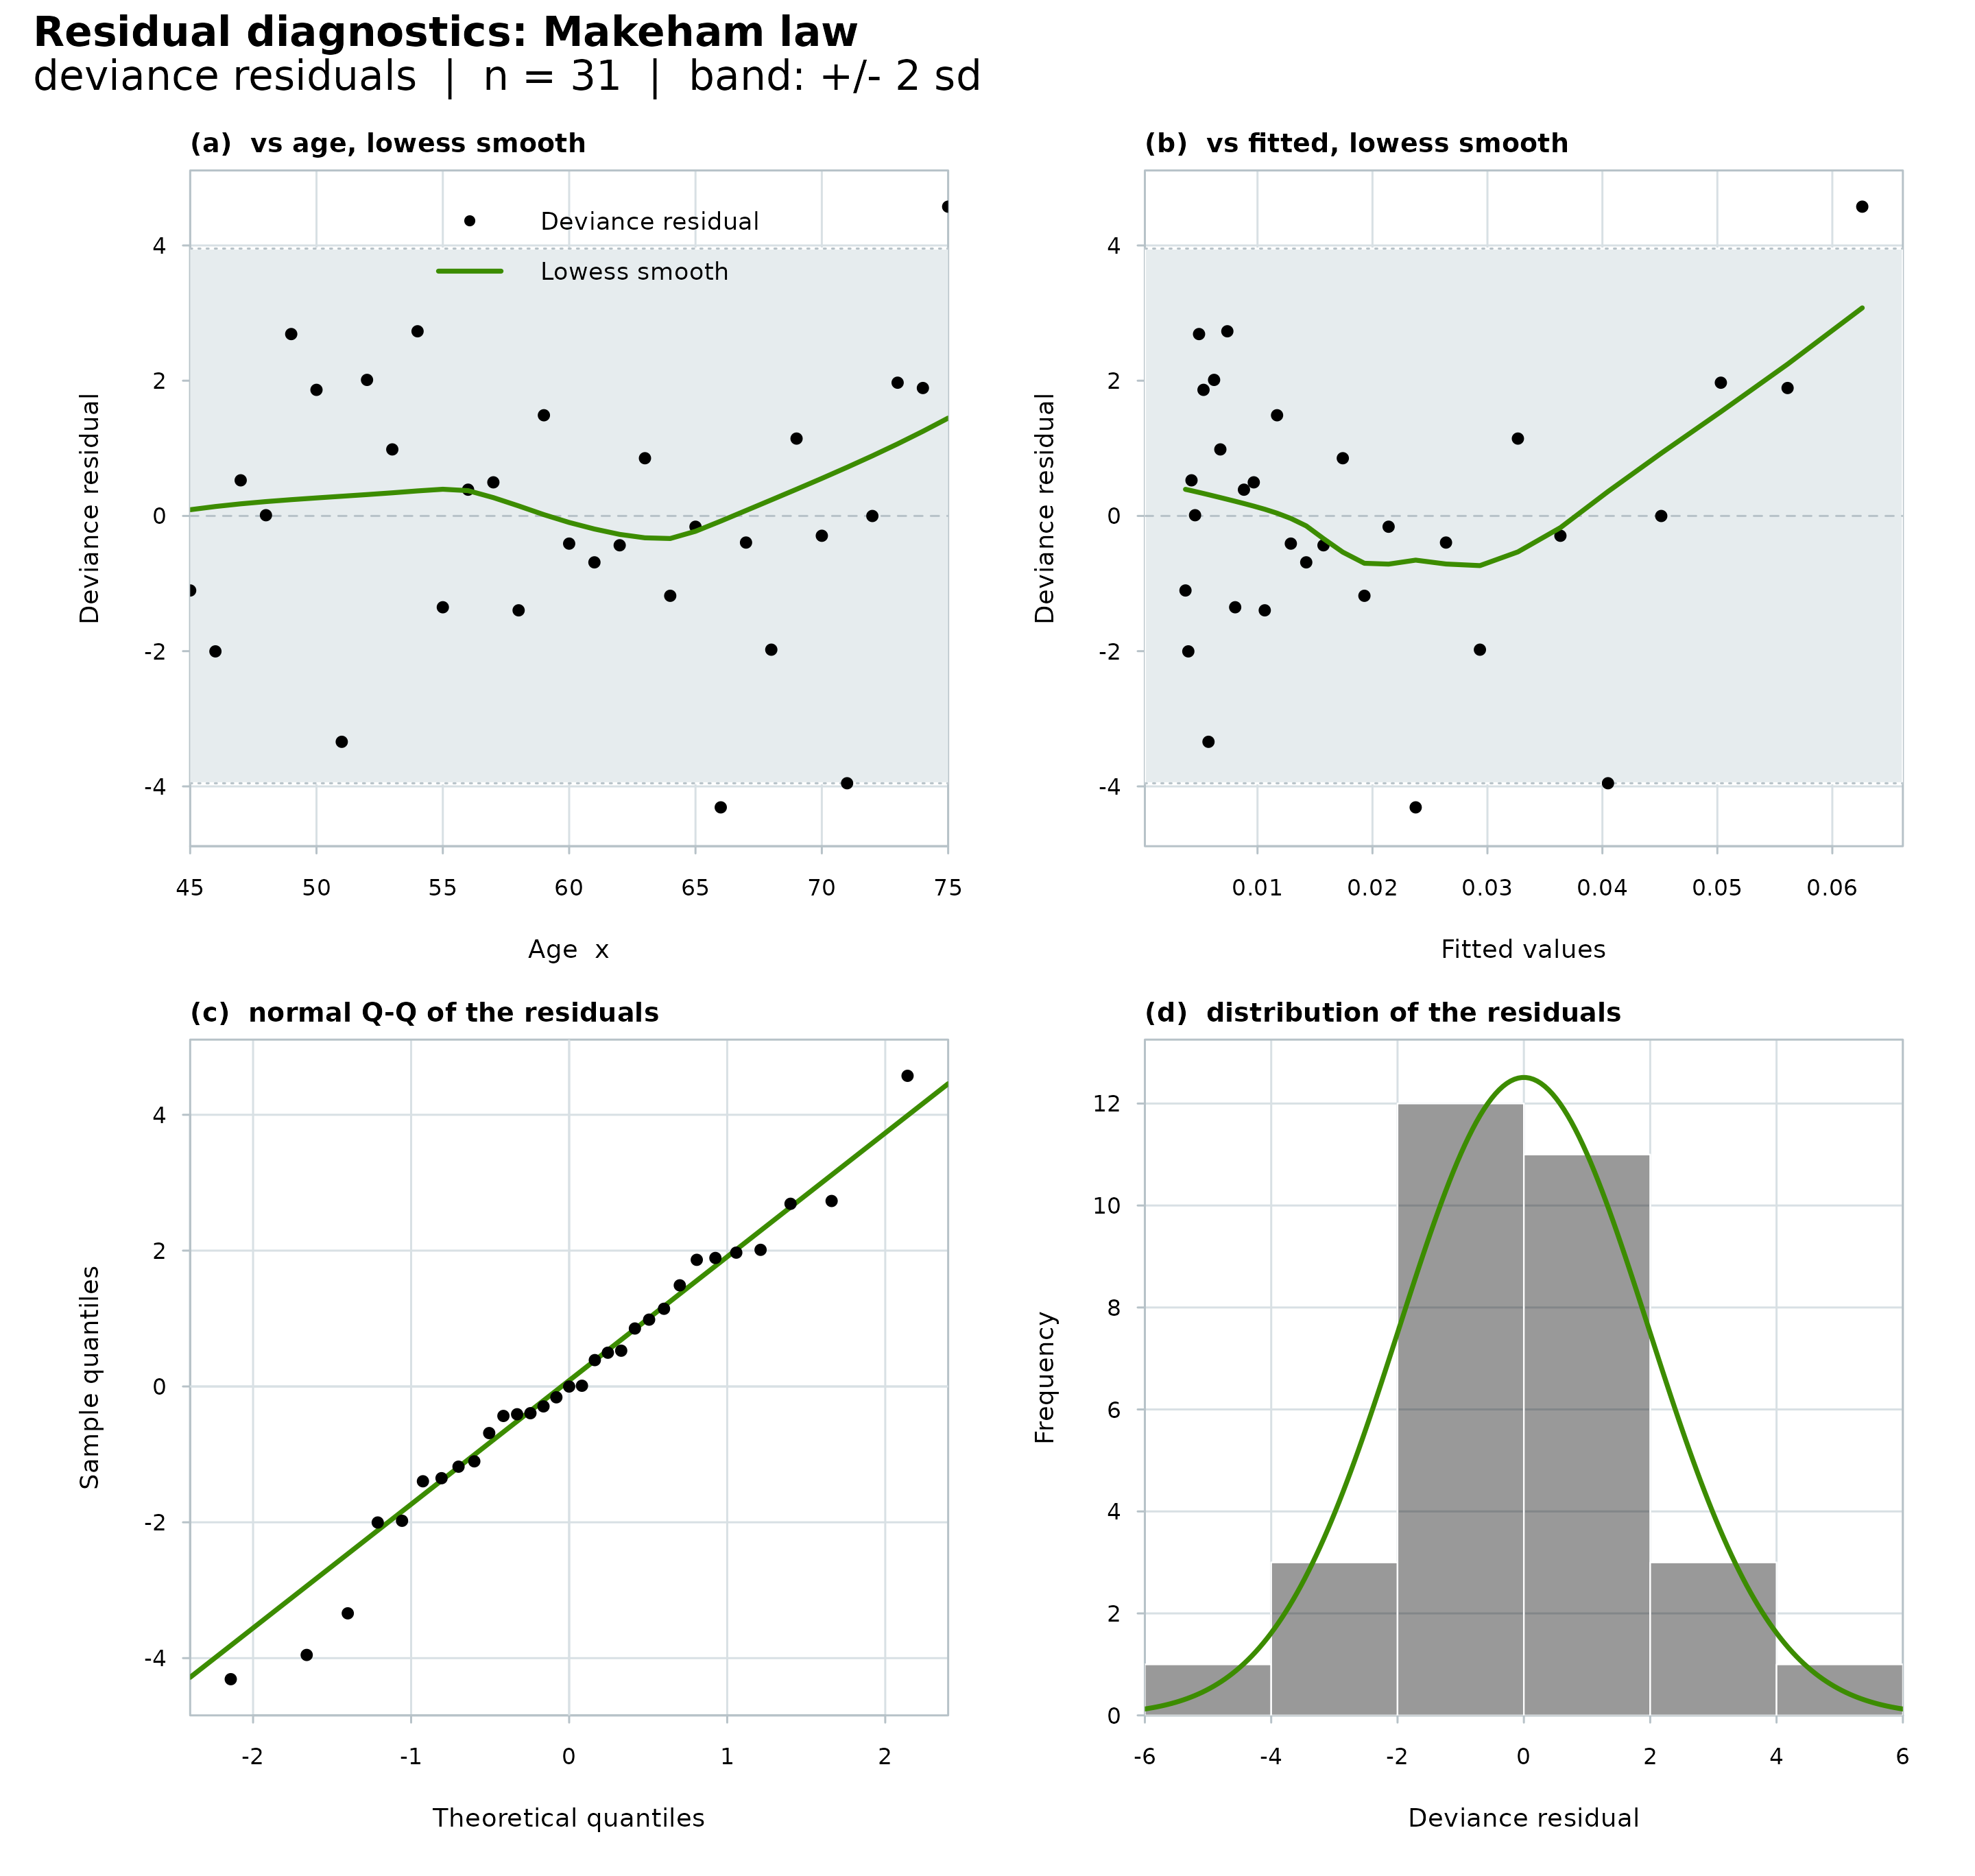
diagnostics give the deviance residuals against age and against the fitted
values, each with a band of two standard deviations and a lowess smooth,
plus a normal Q-Q plot and the residual distribution with a normal density.
Arguments
- x
An object of class
"MortalityLaw".- which
Which figure to draw:
"both"(the default; the fit chart and the residual panels in one figure),"fit"(the fit chart alone) or"diagnostics"(the four residual panels alone).- split
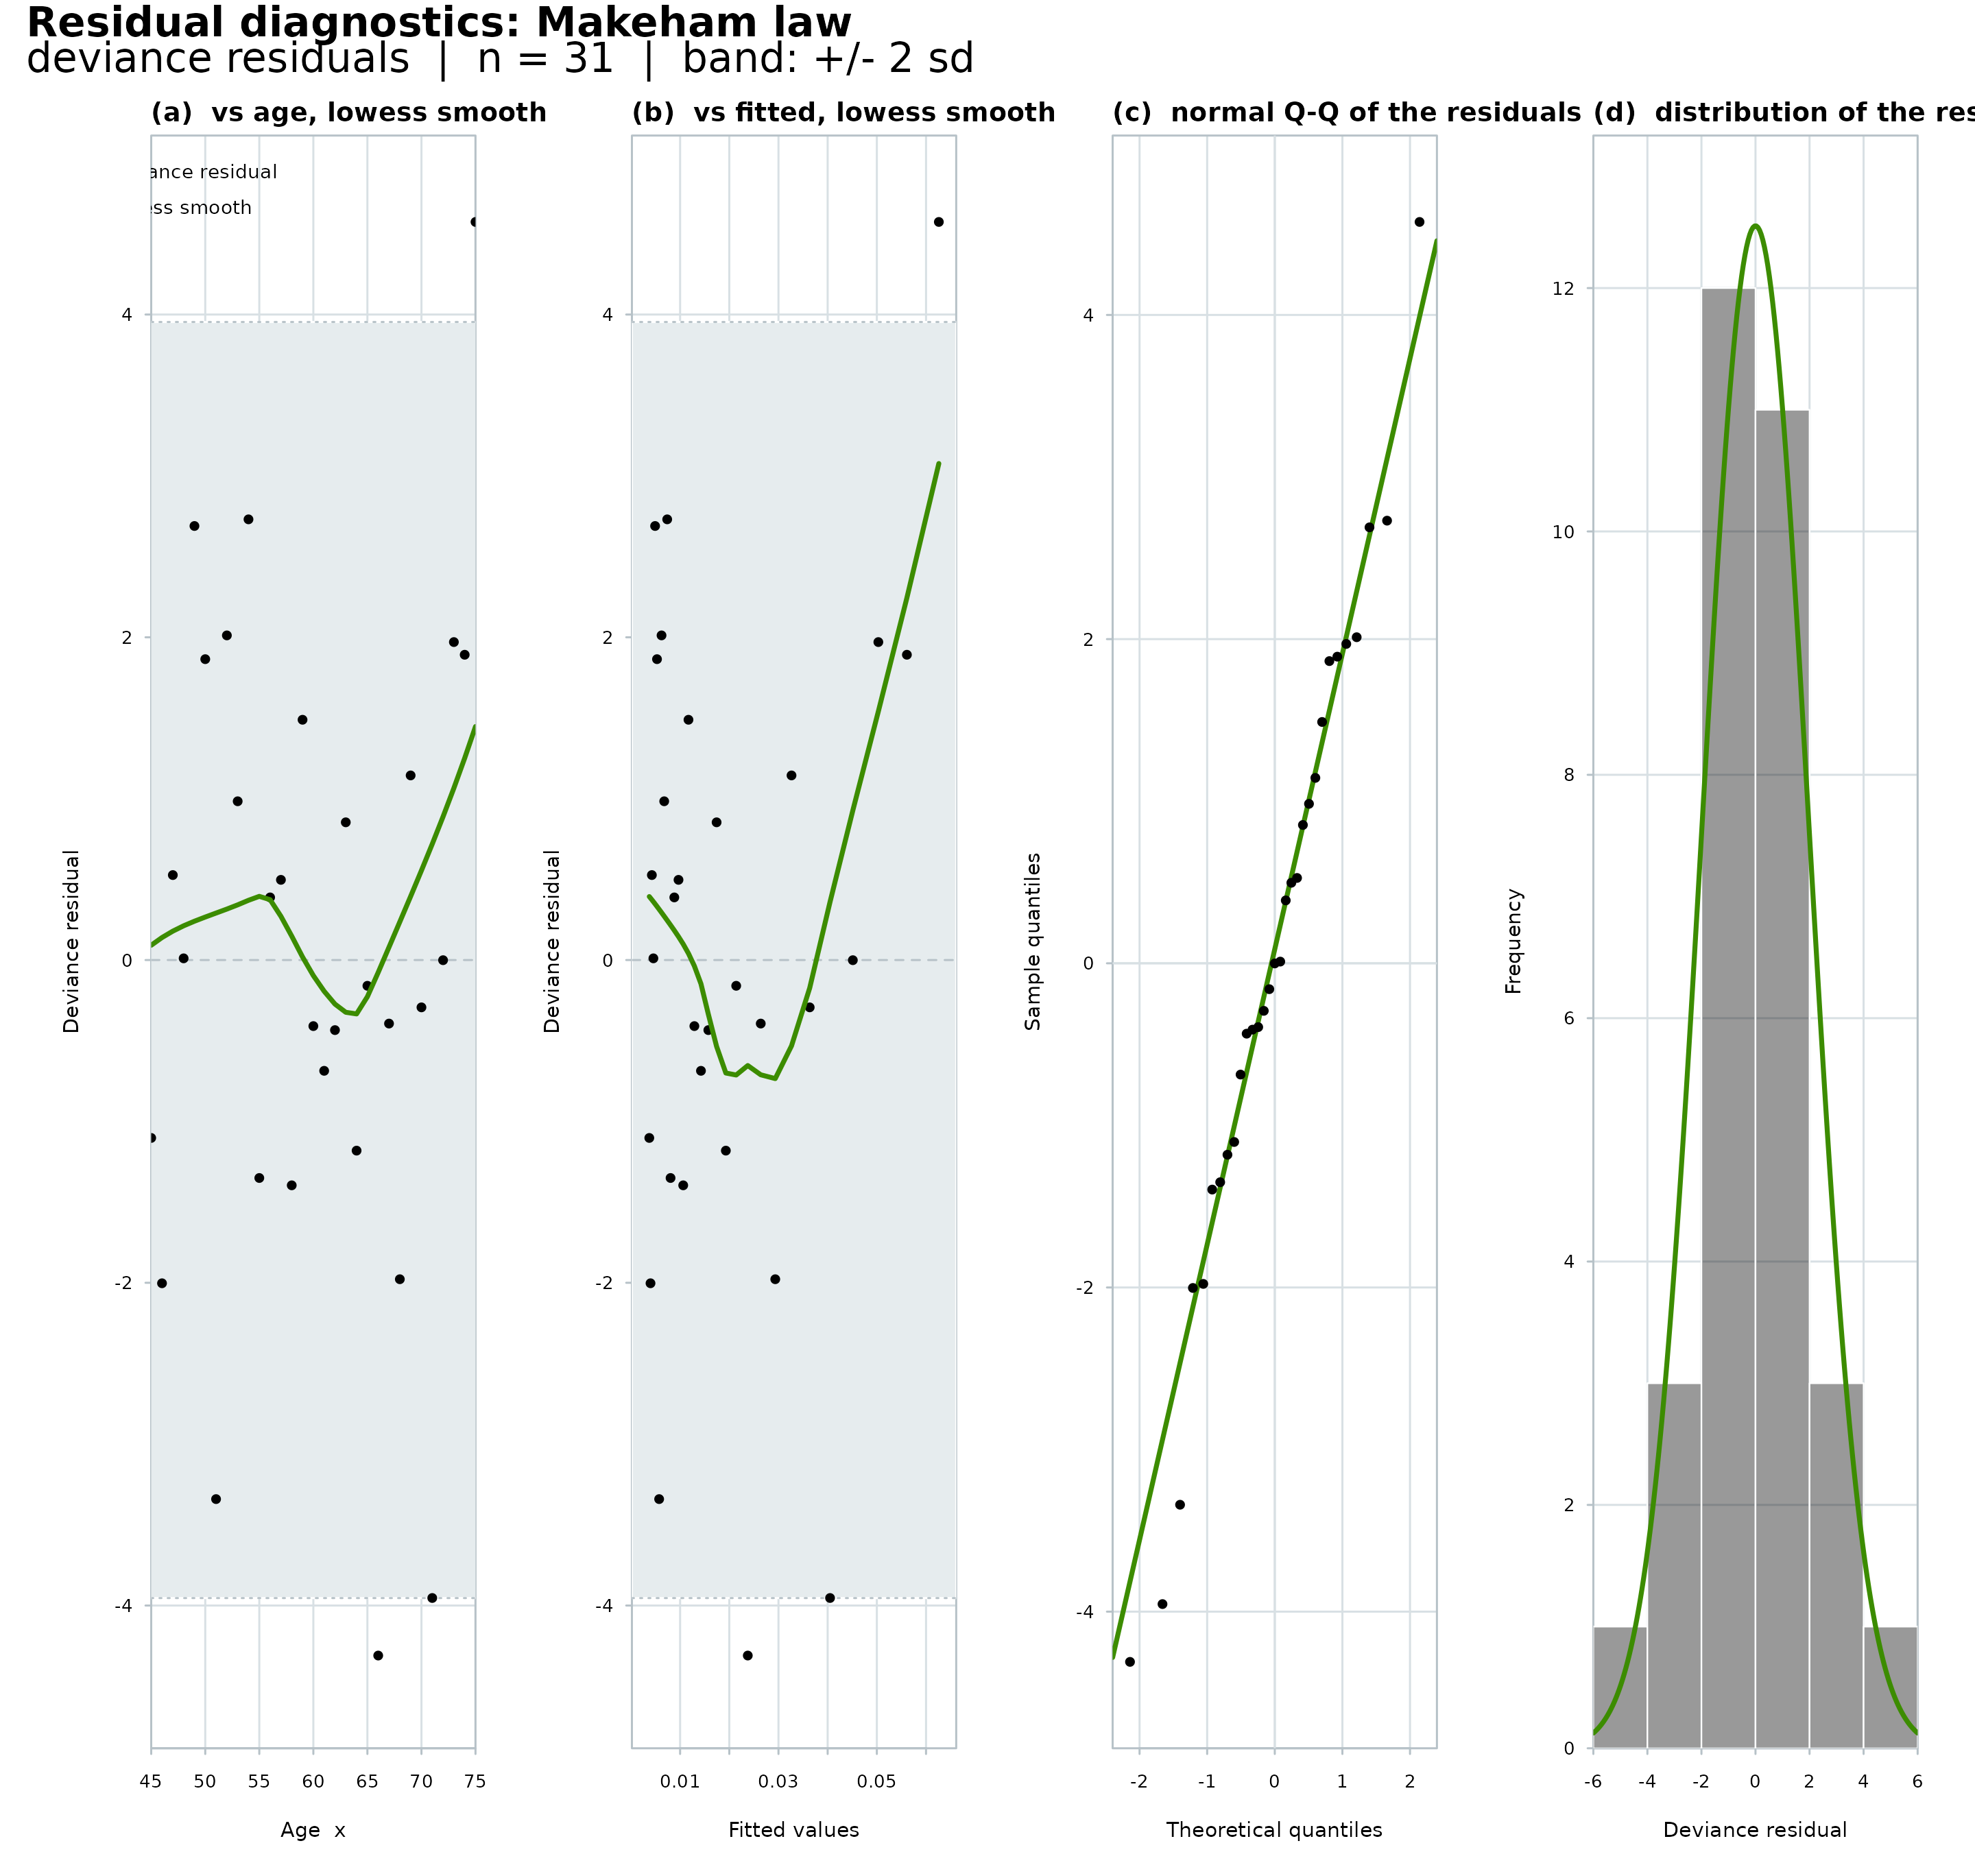
How to arrange the four diagnostic panels:
NULL(the default) draws them in a c(2, 2) grid; give a length-2 integer c(nrow, ncol) to split them yourself, such asc(1, 4)for one row orc(4, 1)for one column. Ignored when only the fit chart is drawn.- ...
Further arguments; currently ignored.
Examples
x <- 45:75
M1 <- MortalityLaw(x = x, Dx = ahmd$Dx[as.character(x), "1950"],
Ex = ahmd$Ex[as.character(x), "1950"], law = "makeham")
plot(M1, which = "fit")
 plot(M1, which = "diagnostics")
 plot(M1, which = "diagnostics", split = c(1, 4))
 plot(M1, which = "both")